In action
Public datasets, rendered by ArcScape.
Two public 10x Genomics datasets, rendered in the browser — ligand–receptor pathway arcs over high-resolution histology, with expression and cluster views a click away.
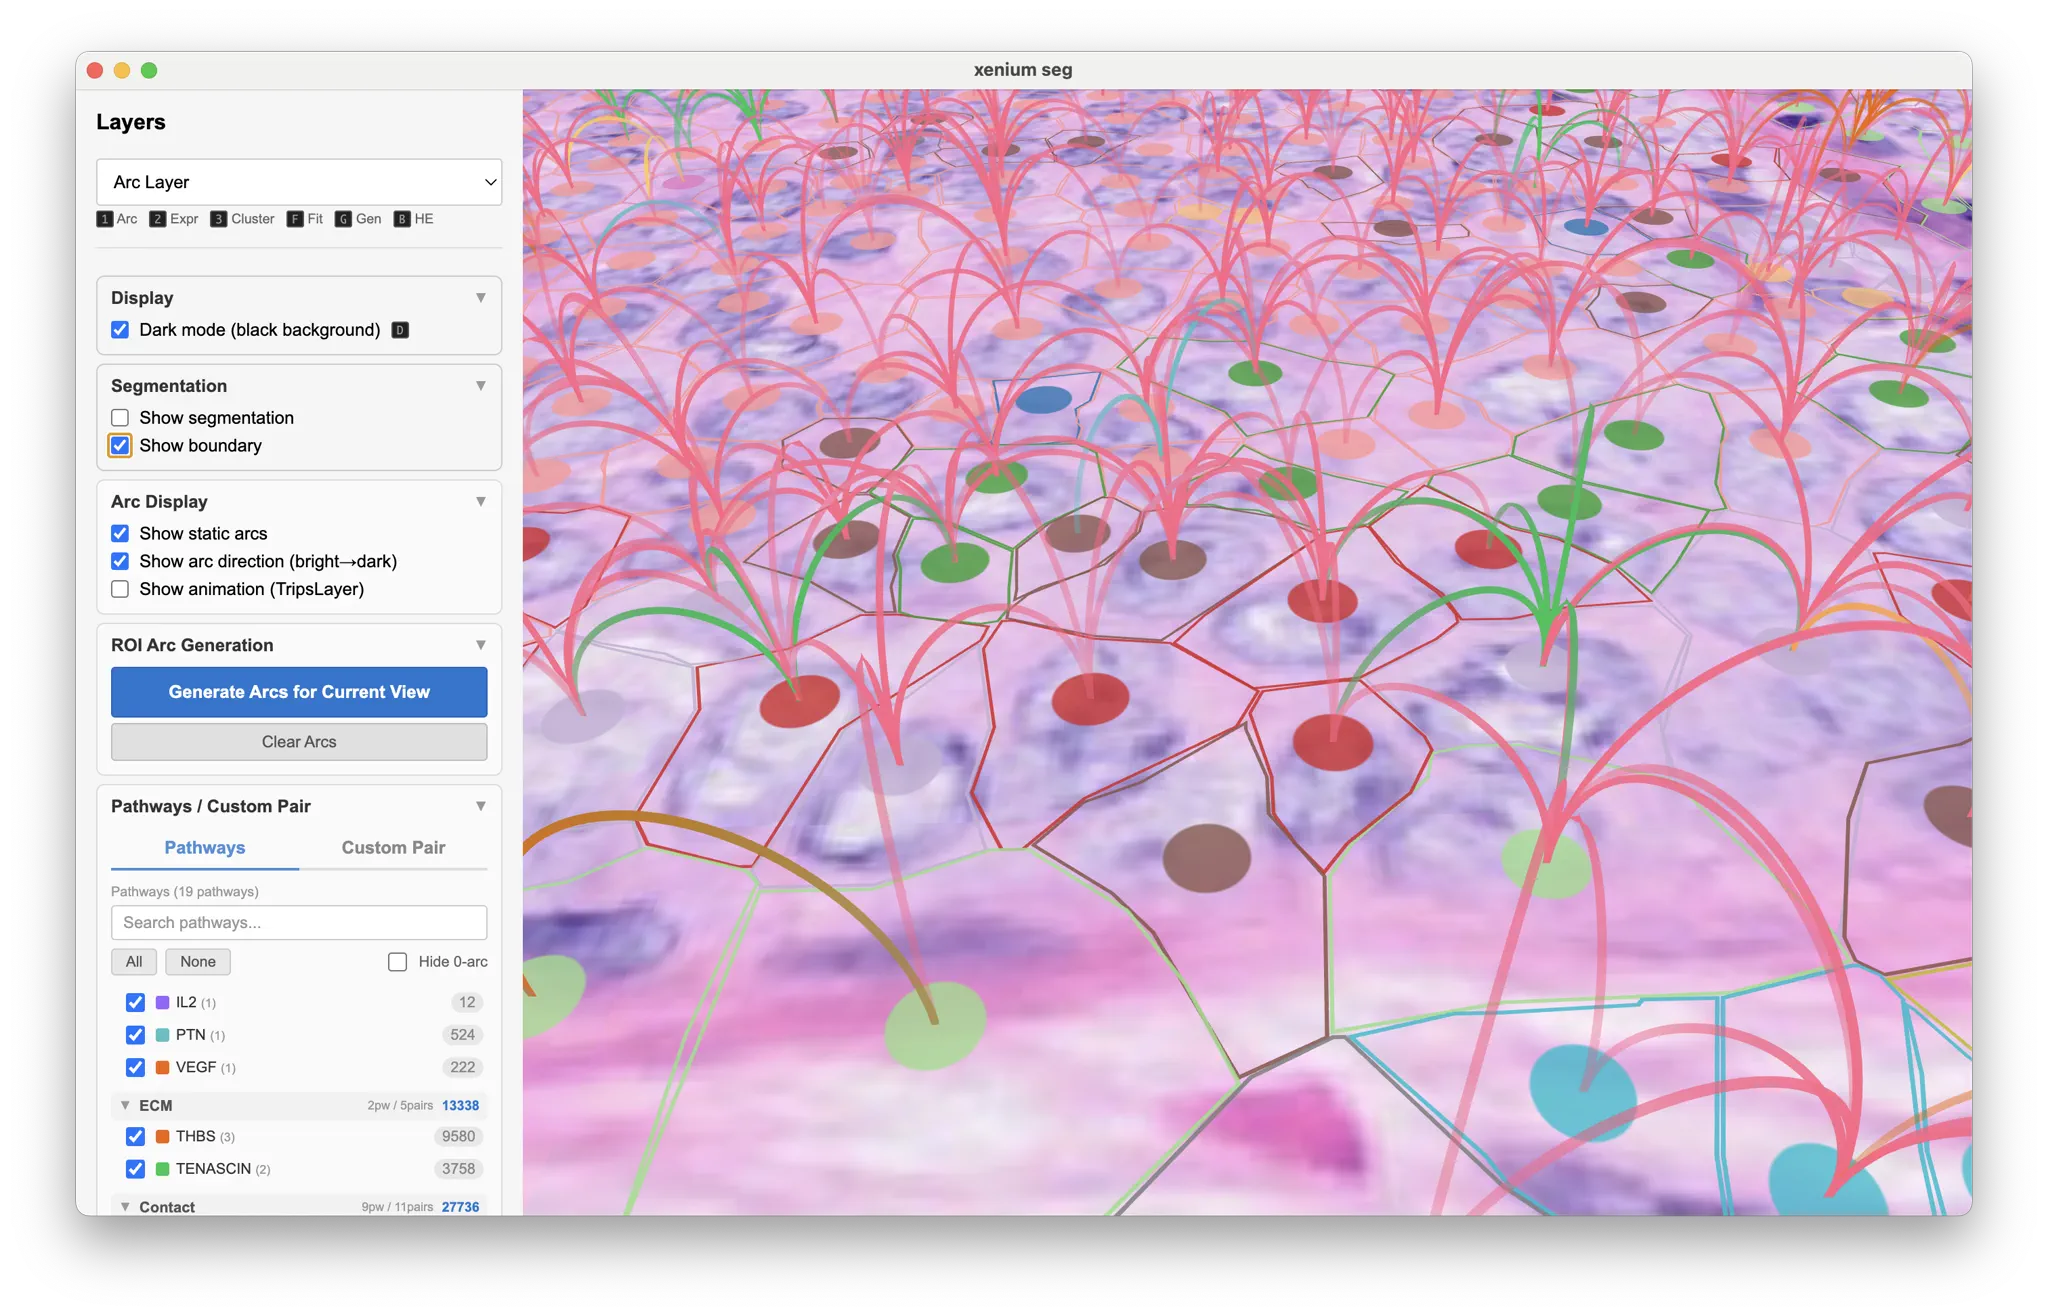
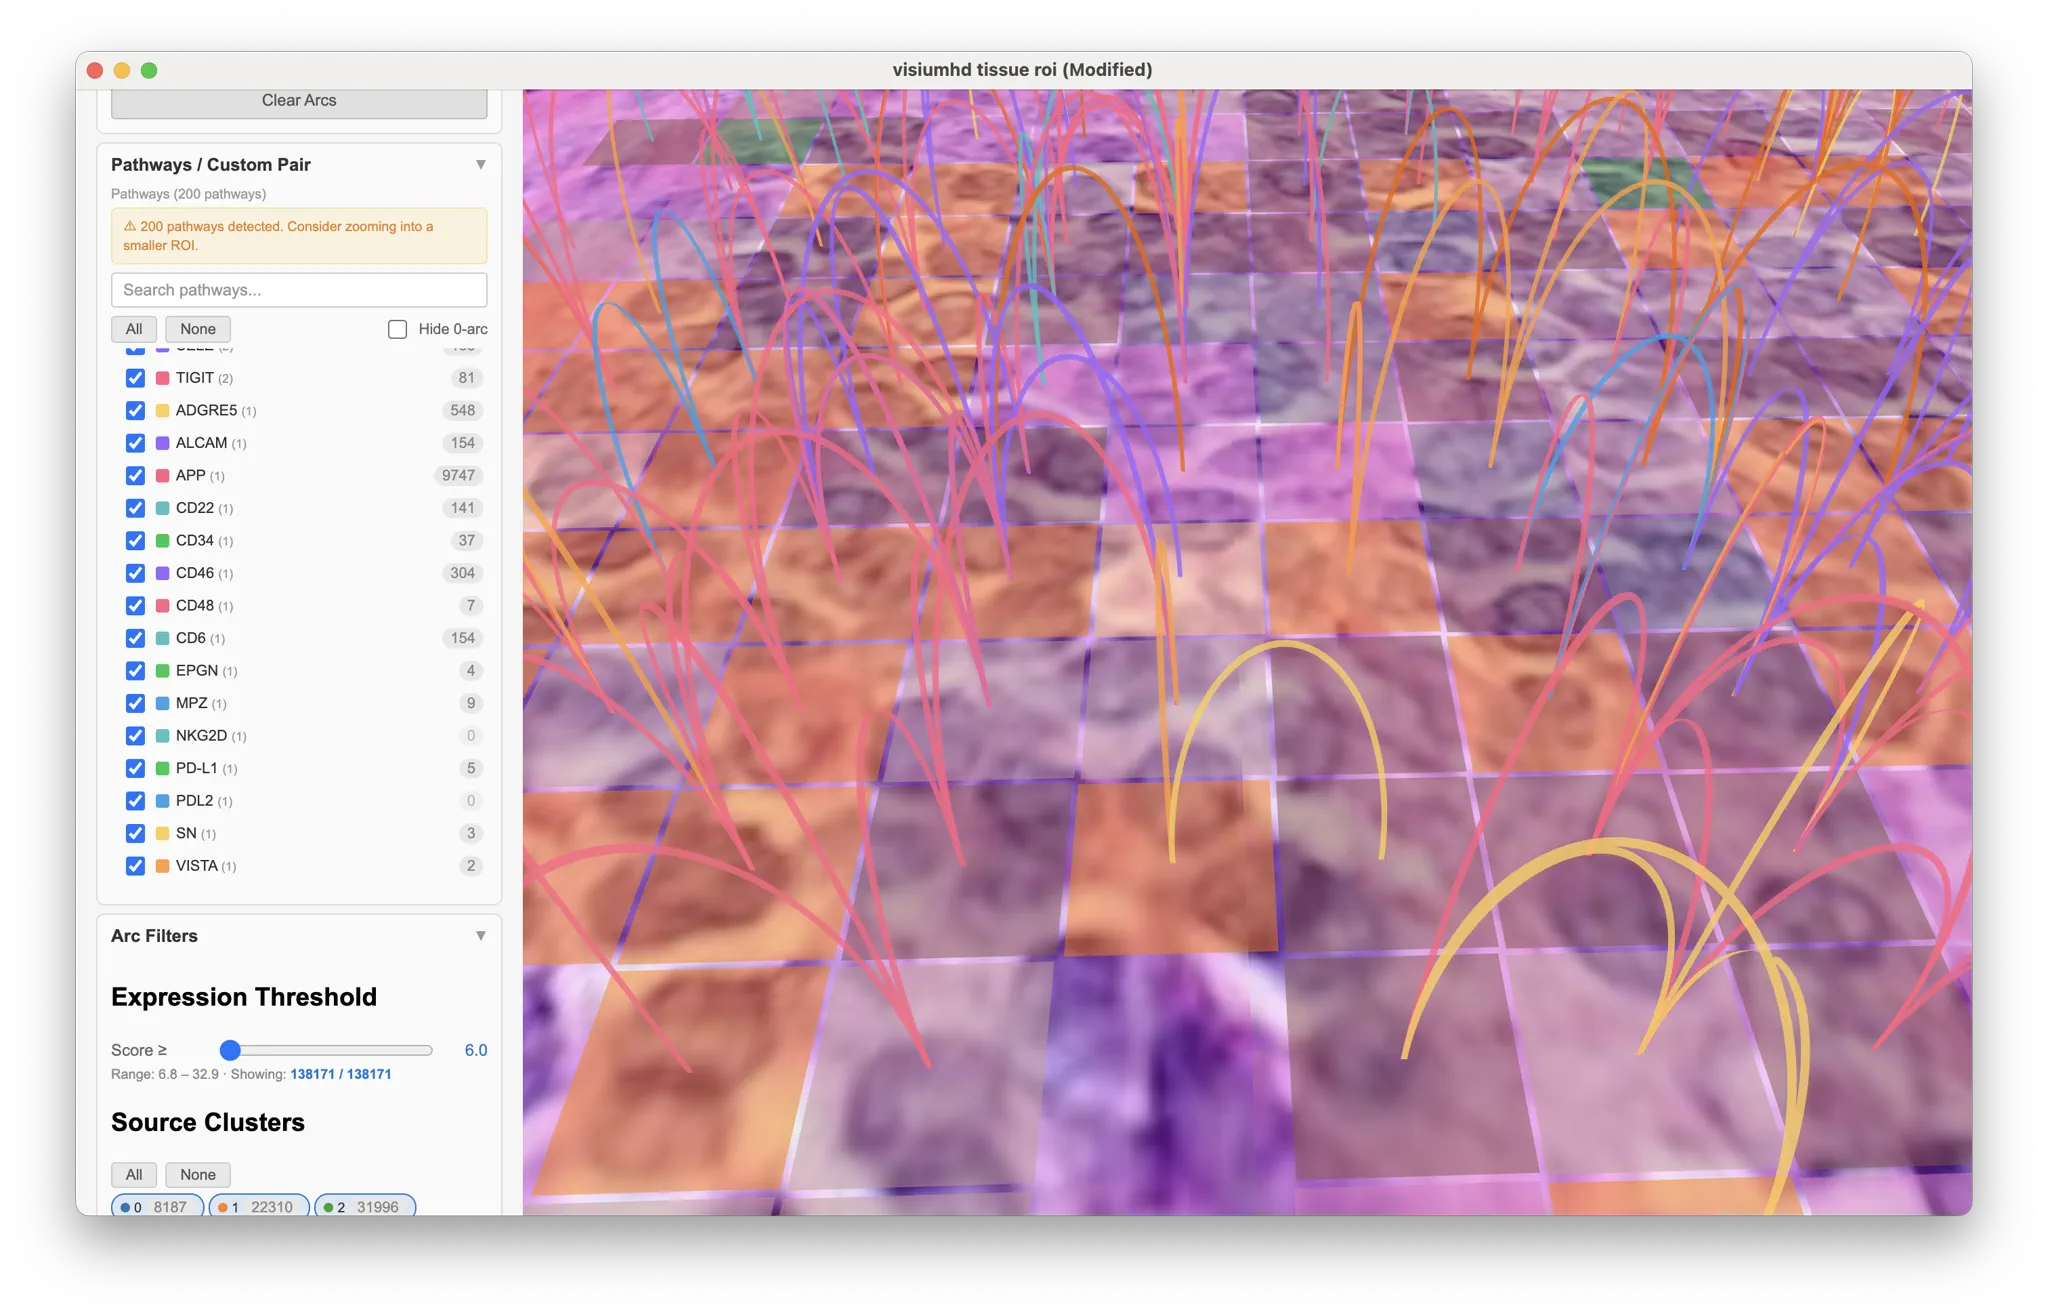
Single-cell spatial omics viewer
Ligand–receptor analysis usually answers at the cluster level — which cell types interact. ArcScape brings the answer down to the cell, drawing those pairs as arcs between individual cells on real spatial coordinates, so you can see where each pathway is active across the tissue.
Walkthrough
Switching layers, filtering pathways, and exploring arcs over high-resolution histology.
Trouble playing it here? Open the original recording ↗
In action
Two public 10x Genomics datasets, rendered in the browser — ligand–receptor pathway arcs over high-resolution histology, with expression and cluster views a click away.
What it does
ArcScape does not run inference. It takes analysis you have already done and puts it back on the tissue, where spatial patterns are visible.
Curated ligand–receptor pairs drawn as arcs between individual cells — not summarised by cluster. The flagship view: where a known pathway is actually active.
Per-gene expression on the tissue, with colormap choices and side-by-side panels for comparing genes under a synchronised camera.
Existing cluster assignments as a colour-coded spatial view. Toggle clusters, adjust point size, and read per-cluster counts.
Full-resolution whole-slide HE as the background, with cell and nucleus boundaries overlaid in the same coordinate system.
Status
ArcScape is being prepared for public release alongside a methods paper. This page is an early preview: the software, documentation and interactive demos are not published yet.
If you would like to try ArcScape on your own data before the release, or have questions about what it can show, please get in touch: atsushi.doi@csml.org